On Sunday evening, Benzinga asked its followers on Twitter what stock they’re buying at the open on Monday? From the replies, Benzinga selected one ticker for technical analysis.
@Compound12pct and @ArguetaSal are buying Facebook, Inc (NASDAQ:FB).
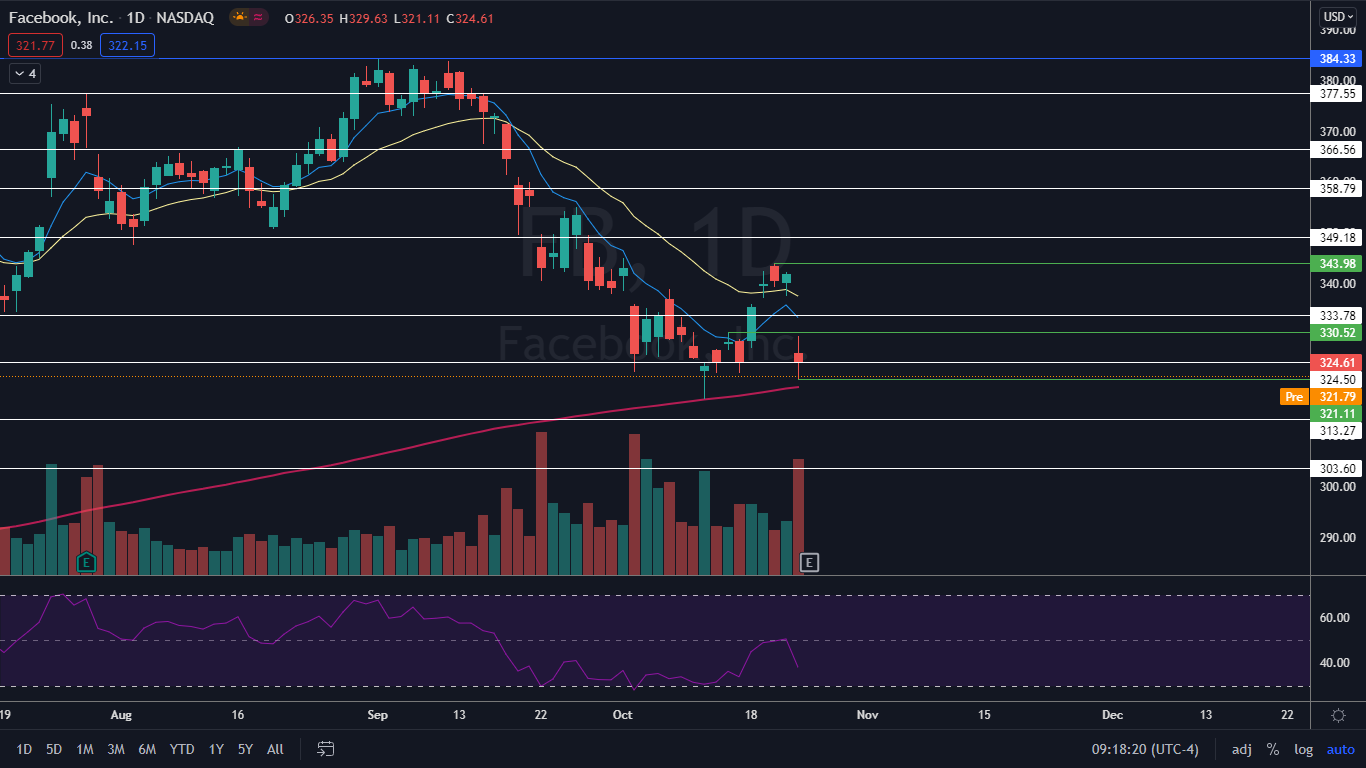
Facebook has been in a steep decline since reaching a Sept. 1 all-time high of $384.33, amid whistleblower accusations and leaked documents claiming to show the social media giant prioritizes profit over people. On Oct. 12. It appeared the worst was over for the stock as it reversed course into an uptrend and Facebook printed an Oct. 20 higher high at $343.98.
The rebound was short-lived, however, due to Facebook falling sharply in sympathy with Snap, Inc (NYSE:SNAP) when the latter plummeted following a worse-than-expected third-quarter earnings print and app store warning.
See Also: What Will Be Facebook’s New Name? Here Are The Betting Odds
The Facebook Chart: Despite gapping down over 4% on Oct. 21 and reaching a low-of-day at $321.11, Facebook is still trading in an uptrend because it hasn’t fallen below the Oct. 12 low. On Friday, Facebook printed a doji candlestick, which indicates a reversal back to the upside may be in the cards although Monday’s candlestick will be needed for confirmation.
Facebook has seen higher than average daily volume lately, which indicates there is a high level of trader and investor interest in the stock. On Friday, 35.22 million shares of Facebook exchanged hands compared to the average 10-day volume of 21.18 million. It’s likely many traders are trying to catch the bottom for a move higher, especially if Facebook has a positive reaction to its earnings print expected Monday after the closing bell.
Facebook’s relative strength index (RSI) is nearing oversold territory at about 37%. When an RSI nears or exceeds the 30% level it can be a buy signal for technical traders.
The stock is trading below the eight-day and 21-day exponential moving averages (EMAs), with the eight-day EMA trending below the 21-day, both of which are bearish indicators. Facebook is holding above the 200-day simple moving average (SMA) and on Friday tested the level as support and held above it, which indicates overall sentiment remains bullish.
- Bulls want to see Facebook hold above the $317 level and for big bullish volume to come in and push the stock up over $343.98 to further confirm the uptrend. The stock has resistance above at $333.78 and $349.18.
- Bears want to see big bearish volume come in and push Facebook down to make a lower low, which will cause the stock to drop below the 200-day SMA. The stock has support below at $324.50 and $313.27.