On Thursday evening, Benzinga asked its followers on Twitter what tickers they wanted reviewed for Friday. From the replies, Benzinga selected one ticker for technical analysis. @freeannajones, and @Artartinvest4 asked for Apple, Inc (NASDAQ:AAPL) to be charted. @Artartinvest noticed unusual volume in the stock at the end of the day.
Apple’s highest volume of the day came in on the 15-minute chart just before the market closed at 3:45 p.m. The volume was bearish although Apple’s price held strong and the stock closed up 0.67%.
During the 5 minutes between 3:49 p.m. and 3:54 p.m. there were four large bearish options trades totaling just over $222,000. The traders chose a strike price of between $120 and $145 and the expiry dates ranged between Friday and Nov. 19.
See Also: Key Takeaways From White House Chip Crisis Meet
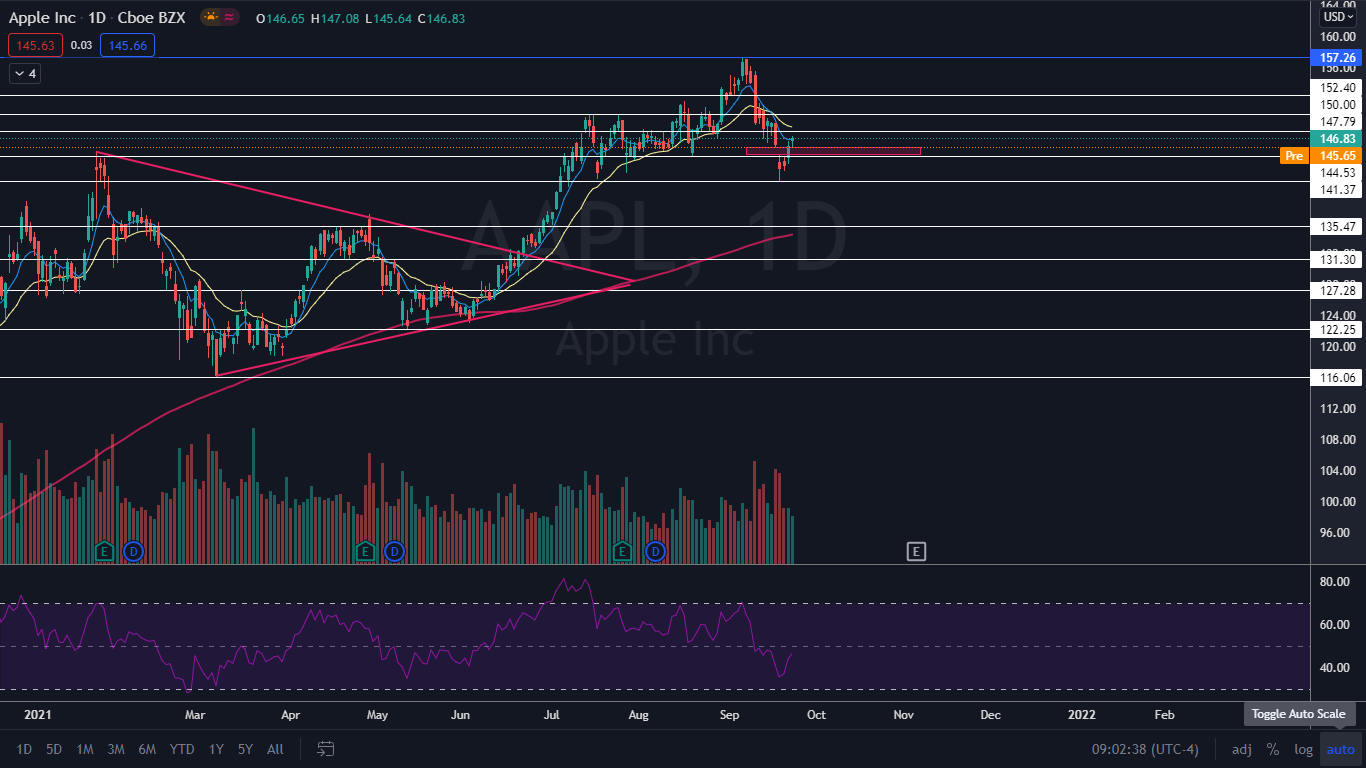
The Apple Chart: Apple’s stock reached a Sept. 7 all-time high of $157.26 before declining over 10% lower over the course of nine trading days. The stock then reached a bottom near the $141 mark and bounced up.
The decline paired with the bounce and settled Apple into a bear flag pattern on the daily chart, with the pole created between Sept. 8 and Sept. 20 and the upward flag formed between Sept. 20 and Thursday.
Thursday’s price action caused Apple to regain the eight-day exponential moving average (EMA), which should negate the bar flag pattern, but in Friday’s premarket session, the stock was trading down about 0.85% which is back below the eight-day EMA.
Traders will want to watch for whether Apple is reacting to the bear flag pattern or if the stock has reversed course into an uptrend and is creating a higher low. The volume at the open should help to give direction, with large bearish volume indicating the bear flag may play out and bullish volume indicating a buy-the-dip scenario.
Apple’s stock has support at $144.53 and a key support level lower at $141.37. The stock has resistance above at the eight-day and 21-day EMAs and $147.79 and $150.