ContextLogic Inc (NASDAQ:WISH), Snap Inc (NYSE:SNAP) and Zynga Inc (NASDAQ:ZNGA) have created double bottom and triple bottom patterns on the daily chart.
A double bottom pattern is a reversal indicator that shows a stock has dropped to a key support level, rebounded, back tested the level as support and is likely to rebound again. It is possible the stock may retest the level as support again creating a triple bottom or even quadruple bottom pattern.
The formation is always identified after a security has dropped in price and is at the bottom of a downtrend whereas a bearish double top pattern is always found in an uptrend. A spike in volume confirms the double bottom pattern was recognized and subsequent increasing volume may indicate the stock will reverse into an uptrend.
- Aggressive bullish traders may choose to take a position when the stock’s volume spikes after the second retest of the support level. Conservative bullish traders may wait to take a position when the stock’s share price has surpassed the level of the initial rebound (the high before the second bounce from the support level).
- Bearish traders may choose to open a short position if the stock rejects the level of the first rebound or if the stock falls beneath the key support level created by the double bottom pattern.
- See Also: Zynga To Launch Multiplayer Imposter Game For Snapchat
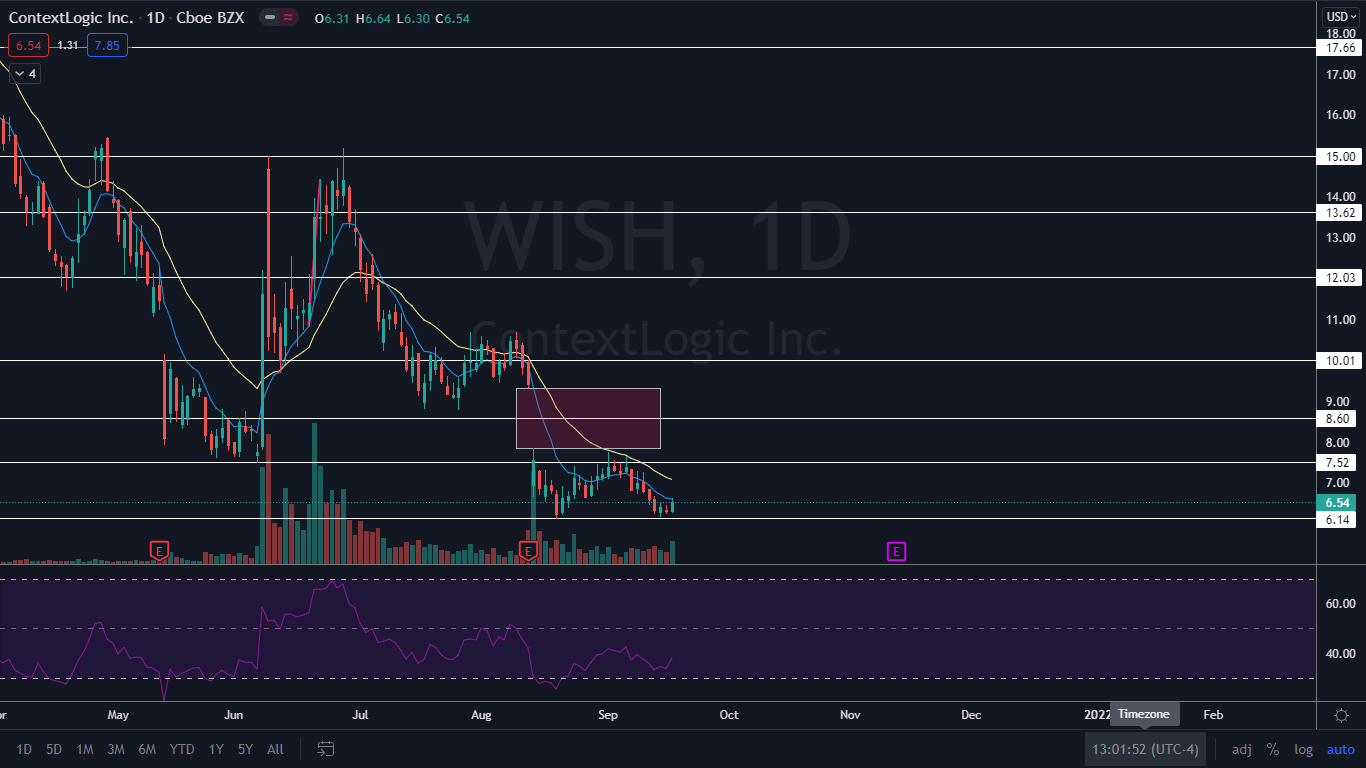
The WISH Chart: With a double bottom pattern created on Aug. 19 and Sept. 15
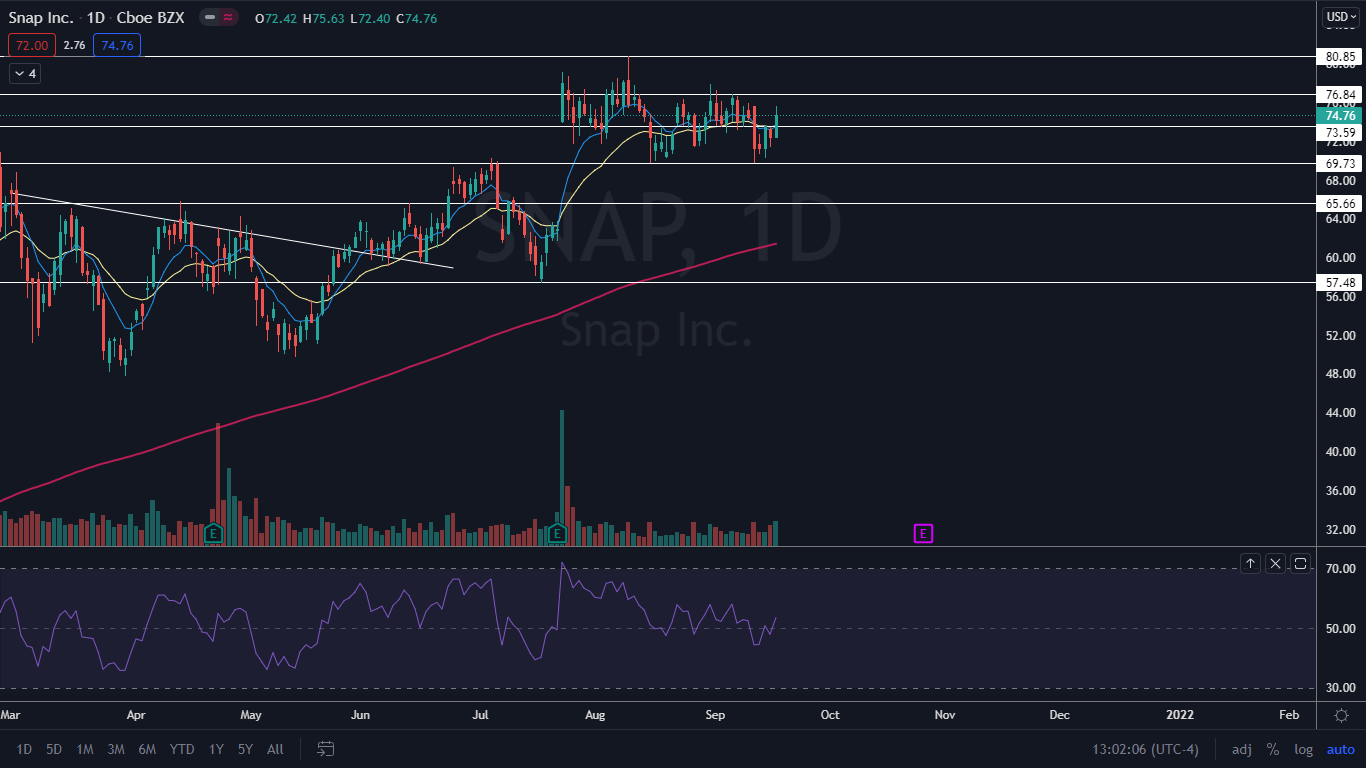
 The SNAP Chart: With a double bottom pattern created on Aug. 16 and Sept. 13
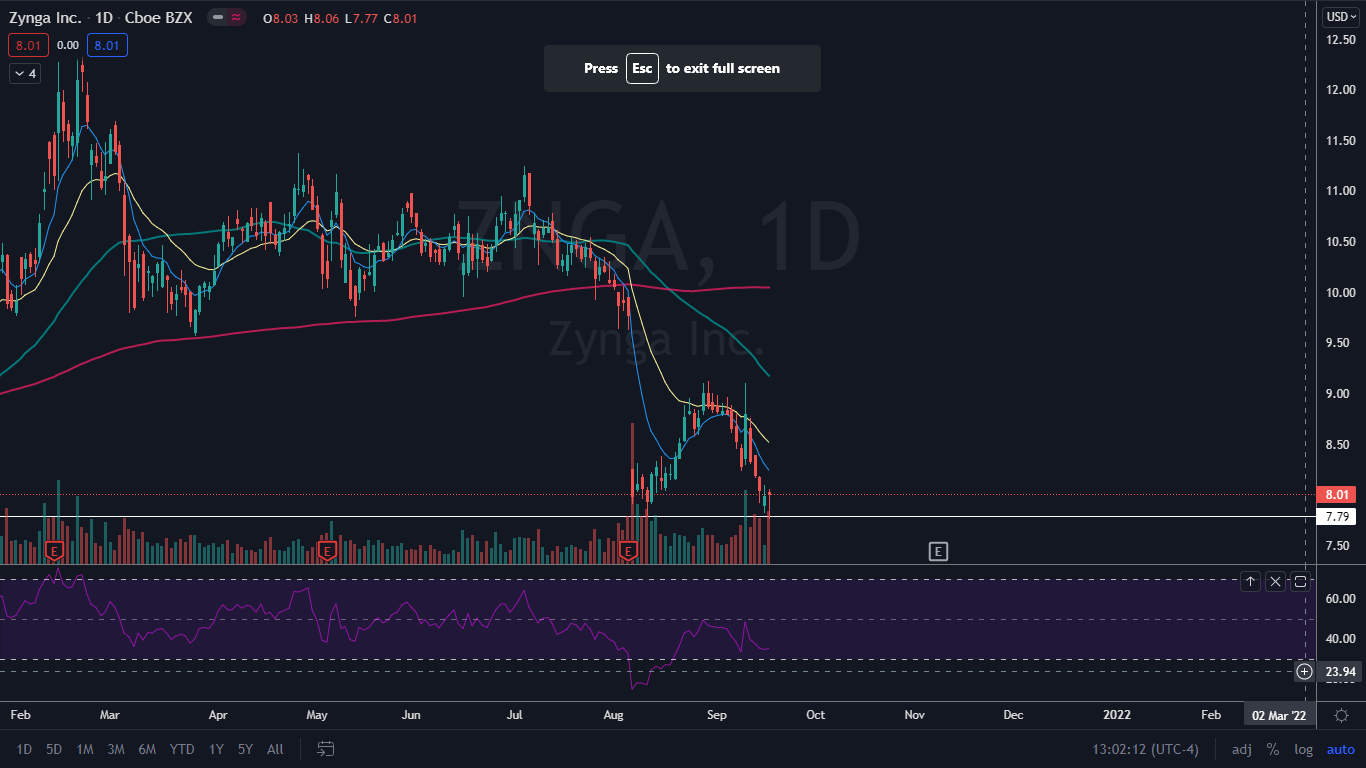
 The ZNGA Chart: With a double bottom pattern created on Aug. 11 and Friday.