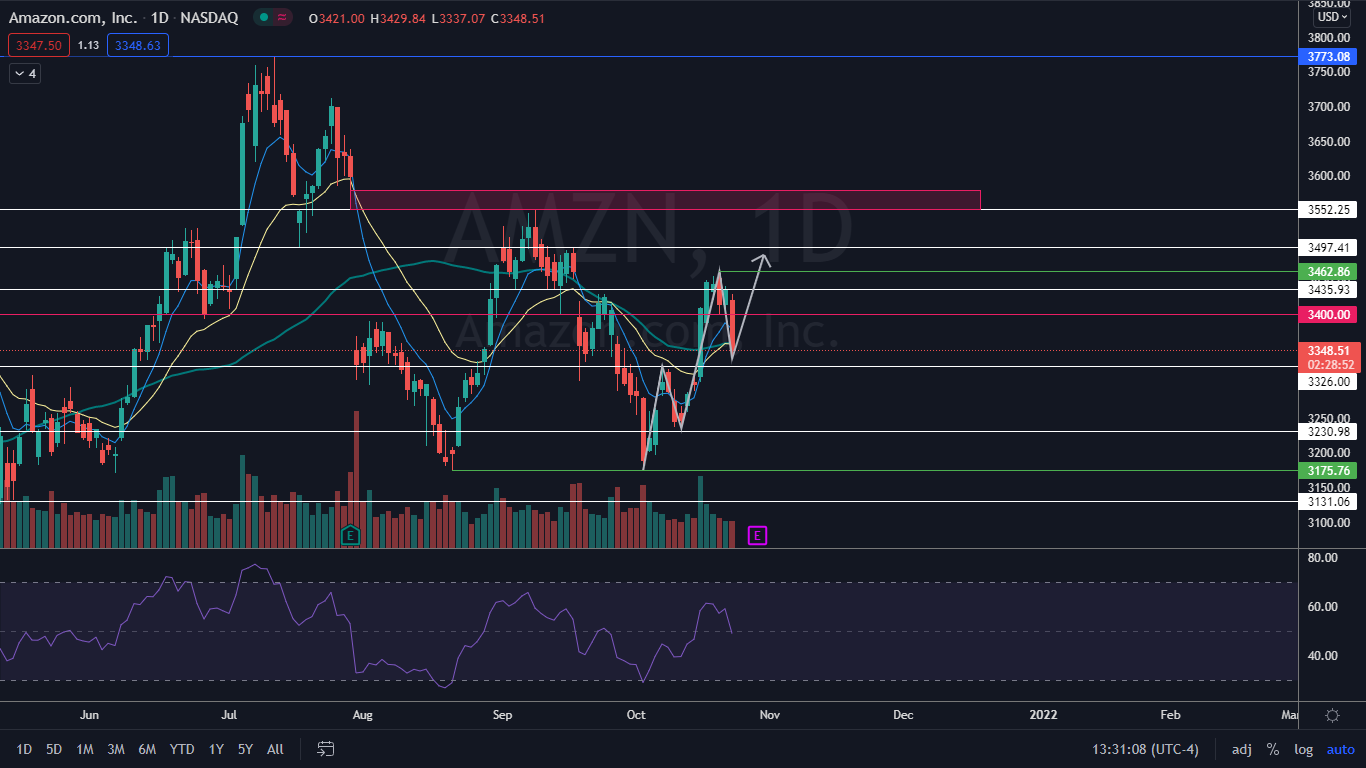
Amazon.com, Inc (NASDAQ:AMZN) created a bullish double bottom pattern on Oct. 4 and reversed course into a solid uptrend. The uptrend has been confirmed by a consistent series of higher highs and higher lows, with the most previous higher high printed on Wednesday at $3462.86 and the most recent higher low at $3230.98 on Oct. 12.
- On Friday, Amazon fell below the $3400 psychological support level, but the bearish action may count as the next higher low.
- The stock needs to trade up over the Oct. 20 high to continue the uptrend. Above the level there is a gap between $3549.99 and $3580.01 that is likely to be filled.
- Amazon has resistance above at $3400, 3435.93 and $3462.86 and support below at $3326, $3300 and $3230.98.
 Want direct analysis? Find me in the BZ Pro lounge! Click here for a free trial.