
Ethereum (CRYPTO: ETH) broke up from a long-term descending trendline on Oct. 25 and continued to trend higher over the days that followed to close the week up a whopping 20%.
The break up from the trend line and subsequent surge higher is significant because it occurred on the weekly chart.
A descending trend line acts as a resistance level and indicates there are more sellers than buyers because the price continues to fall.
In order for a trendline to be considered valid, the stock or crypto must touch the line on at least three occasions. After that, the more times the trendline is touched, the weaker it becomes.
- Bullish traders can watch for a stock or crypto to break up from the descending trendline. If the break occurs on high volume, it can indicate the downtrend is over and a rally may be on the horizon. It’s possible the stock or crypto may fall down to back-test the descending trendline as support before heading higher again.
- For bearish traders, “the trend is your friend” (until it’s not), and a touch and rejection of the descending trendline can offer a good short entry. A bearish trader would stop out of this type of trade if the stock or crypto broke above the trendline.
Want direct analysis? Find me in the BZ Pro lounge! Click here for a free trial.
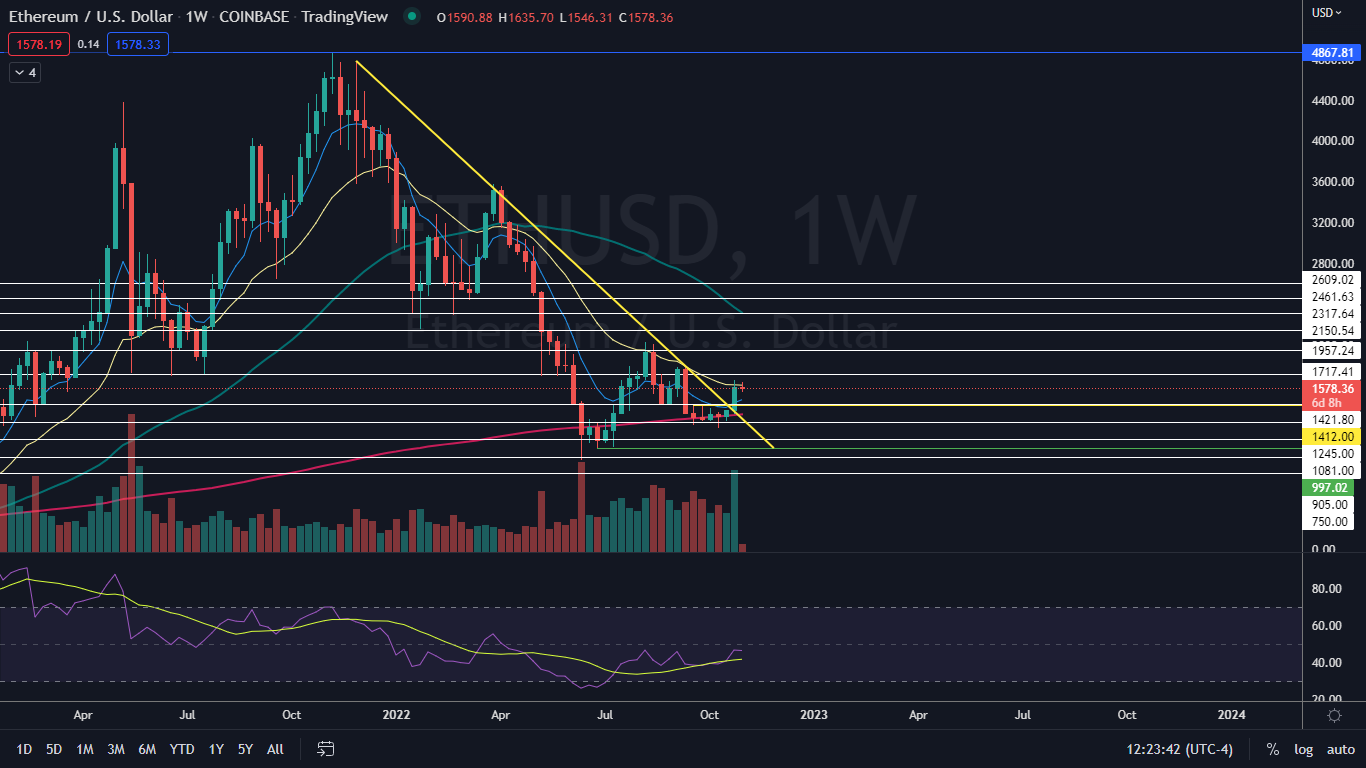
The Weekly Ethereum Chart: Ethereum started the week with an inside bar pattern, opening just under the 21-day exponential moving average on the weekly chart. The inside bar pattern leans bullish because Ethereum was trading higher before forming it and because the inside bar is printing near the upper range of last week’s mother bar.
- If the crypto breaks down from Monday’s low-of-day on Tuesday, bullish traders can watch for a possible bull flag pattern to develop over the next few weeks. For the pattern to remain intact, bullish traders will want to see the crypto hold above the eight-day EMA on the weekly chart.
- Although Ethereum has confirmed an uptrend on the daily chart, the crypto hasn’t printed a higher high or a higher low to confirm an uptrend on the larger time frame. Over the next few weeks, Ethereum will need to print a weekly bullish reversal candlestick, such as a doji or hammer candlestick, above 1,190 to confirm an uptrend.
- Ethereum has resistance above on the daily chart at $1,717.41 and $1,957.24 and support below at $1,421.80 and $1,245.
 See Also: Dogecoin Raises Eyebrows, Elon Musk Takes Charge At Twitter, Apple In For Setback And More: 5 Key Stories You May Have Missed From This Weekend