Shares of AT&T Inc. (NYSE: T) have run into a wall of resistance. This means they may be about to stage a breakout, which would be bullish for the stock.
It looks like the downtrend in Apple Inc. (NASDAQ: AAPL) may continue. Shares may be breaking support around the important $139 level. If this happens it could set the stage for a move lower.
Shares of Advanced Micro Devices, Inc. (NYSE: AMD) have been ripping higher. But they’ve reached a potential resistance level. That may put a halt or pause to the rally.
Instead of slowing down, being transitory or tapering off, the move higher in inflation may just be getting started. At least that’s what the action in the Energy Select Sector SPDR Fund (NYSE: XLE) ETF could be telling us. It looks to be on the verge of a long-term breakout.
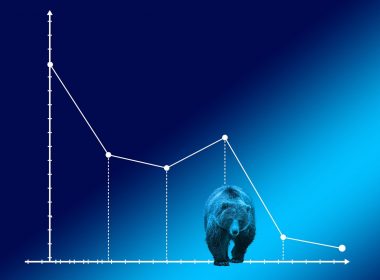
If history is a guide, there’s a chance that the recent selloff in the market may have just gotten started. As you can see on the below chart of the Dow Jones Industrial Average going back to 1897, the current move lower is barely visible.
There have been many bear markets that lasted for many months or even years.
The selling in the small-cap sector of the stock market may be about to pause or at least halt. After a nasty move lower the iShares Russell 2000 ETF (ARCA: IWM) has reached a level that has been resistance in the past. Sometimes, levels that had been resistance can convert into support.
When ETFs drop to support levels and become oversold, they tend to rebound or rally. That may be the case with The Real Estate Select Sector SPDR Fund (NYSE: XLRE).
Interest rates are skyrocketing. The speed and rate of the recent move higher in 10-year U.S. Treasury yields is unprecedented. As you can see on the following chart, there has been nothing since at least 1963 that even comes close.
This could have a significant impact on both the economy and the stock market. And it won’t be good.
The stock market is rebounding but there may not be any follow-through. At least, that’s what the Financial Select Sector SPDR Fund (NYSE: XLF) says. This ETF tracks the important financial sector.